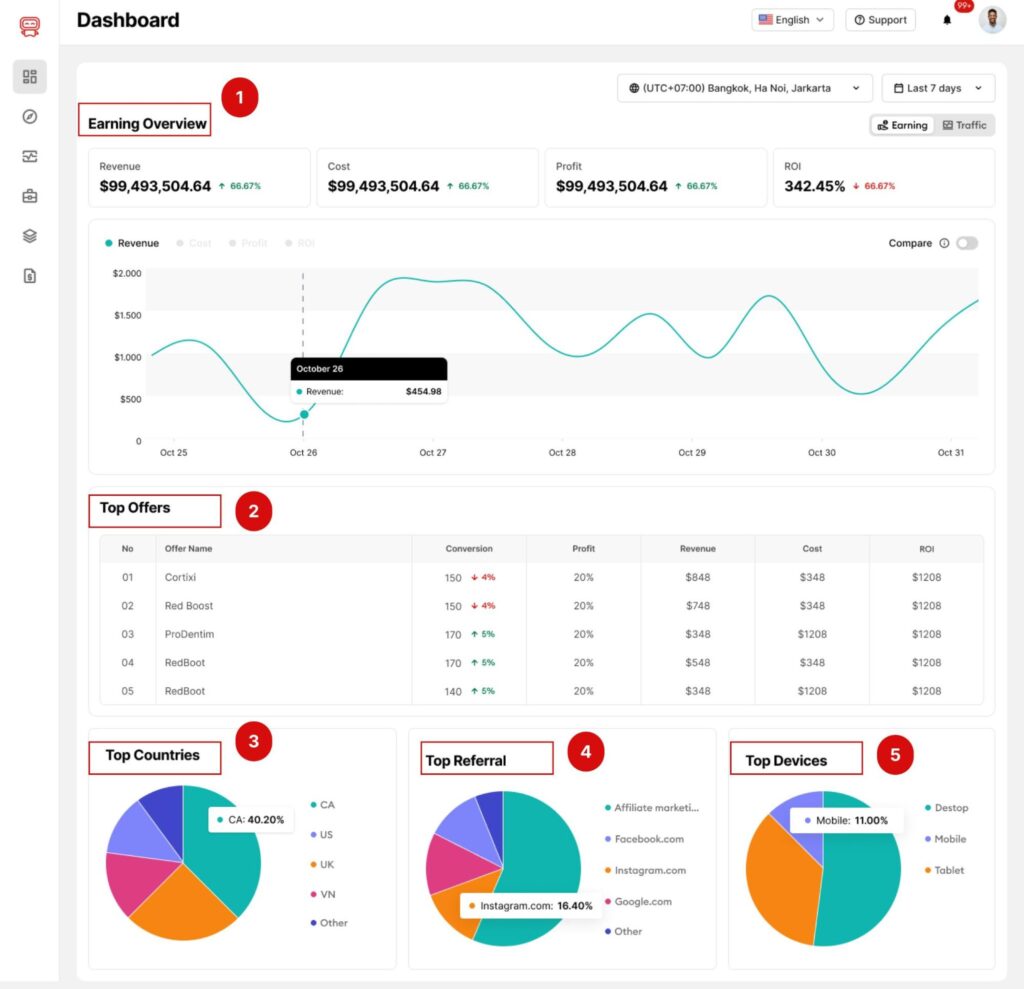
Partners can track all the details of your Affiliate Marketing campaign performances and get a better overview of various metrics through the Partner Dashboard on Permate.
Partner Dashboard helps you better understand and make the necessary adjustments to improve your performance.
The Dashboard includes five main sections: Earnings Overview / Traffic Overview, Top Offers, Top Countries, Top Referrals, and Top Devices.

1. Earnings Overview / Traffic Overview
Partners can select one of two tabs in the left corner of the screen to view Earnings Overview or Traffic Overview.
Earnings Overview tab:
- Revenue: Estimated by conversions from Viewers to Buyers. Please note that this is not the final payment from the Brand to you.
- Cost: is the cost you have spent, often recorded as advertising costs.
- Profit: Profit after taking Revenue – Cost.
- ROI (Return On Investment): is an index used to measure the ratio of profit to the total cost you spent.
Traffic Overview tab:
- Visit: The number of visitors directed to your brand’s site from your affiliate link
- Conversions: Total conversion you get
- EPV: Earning Per visit
- ROI: Return On Investment): is an index used to measure the ratio of profit to the total cost you spent.
2. Top Offers
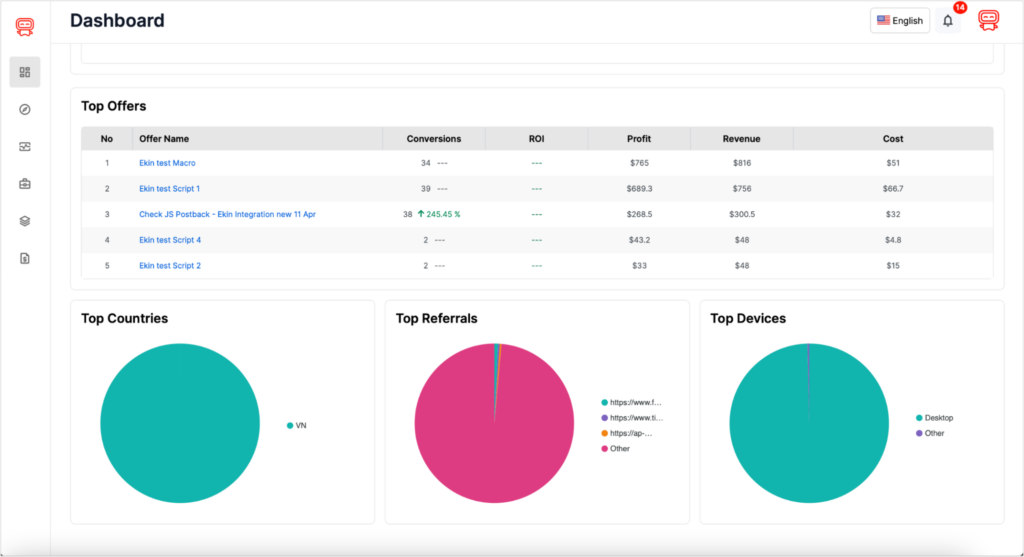
Featured campaign offers that bring in the highest revenue among all the campaigns you have participated in. Here, you can view detailed metrics for each Top Offer, such as Conversion, ROI, Profit, Revenue, and Cost.
3. Top Countries
The pie chart indicates which countries your Revenue comes from.
4. Top Referrals
The pie chart shows the origin of the Traffic Sources from which Users access your offer.
5. Top Devices
The pie chart displays the Device the User uses when they click on your traffic source.


